
Data & formatting guidelines
File formats
Ratio.City’s current upload process accepts the following file formats with the size limit of 250MB.
Geospatial data
GeoJSON
Zipped Shapefiles
Our system can process zipped files, not zipped folders. You must select all the files and zip them rather than the folder containing the files
We typically need these 4 files: .shp, .prj, .dbf, and .shx but it's common for .qpj, .cpg to be included as well
Zipped Shapefiles tend to be smaller, so if your GeoJSON is larger than 250MB, you could try converting it to this format
Non-geospatial data
CSV
Requires latitude and longitude coordinates in decimal degrees, addresses, or both to geolocate
If you are using only addresses (without coordinate data), your map layer will be limited to 15,000 address points
CSV uploads can only appear on our map as point data (for other types of visualizations based on CSVs, please contact data@ratio.city regarding additional services)
You can use our sample CSV as a starting point and reference for formatting
If you currently have coordinates in DMS format, you can follow this tutorial to convert them to decimal degrees before upload.
Converting files to the correct format
Formatting your data
General formatting best practices
Follow our formatting best practices for the best results when you upload your data. This will reduce the number of errors during upload and ensure all your records appear correctly.
Each unique feature should have its own row (eg. even if it’s the same project, if there are two buildings with unique data, each building should be on its own row)
If a value is missing or null, leave the cell blank (zero should only be used if the value is actually zero)
CSVs must have a header row
Example of a well-formatted dataset 👍

Example of a poorly-formatted dataset (do not do this)

Formatting for CSVs
For CSV uploads, we can geolocate your points with either latitude and longitude coordinates, addresses, or both. Coordinates are more accurate and are preferred over addresses.
Latitude & longtitude coordinates
Ideally, separate latitude and longitude coordinates into two different columns. Currently, we require coordinates to be in decimal degrees. If you have DMS coordinates, you can follow this tutorial to convert them.
If your coordinates are in one field together rather than two separate fields, that is acceptable as well.

Addresses
A full address should contain at least a street number, street name, and direction, if applicable, within one or more columns (eg. 1 Bloor St W). If your dataset covers multiple cities and/or countries, please ensure that information is included since some street numbers and names exist in more than one city/country.
You can also include state/province information and the zip/postal code.
The more complete your address information is, the more accurately we can geolocate your points.

Data types
Selecting the correct data type is really important. It ensures that the values in your dataset will be displayed correctly and, in some cases, allows you to do unit conversions, use different filter types in Locate mode, or unlock different visualizations in Explore mode.
This section goes over the available data types for our platform.
String/text
Text fields can contain alphabetical and numeric characters as well as symbols.
You might use string/text for:
Project names
IDs or file numbers eg. “DA-98726”
Construction status
When in doubt, use string.
Numbers
Raw numbers are the optimal format
Do not include comma separators or symbols eg. dollar or percentage signs (see: sold_percent and sold_price examples below)
Do not include units eg. metres/feet; you will define those in the import process instead (see: height_metres example below)
Percentages should be in number (out of 100) format ie. for 13.5%, format your value as 13.5 rather than 0.135 (see: sold_percent example below)

Integer
Numerical values with whole numbers (no decimals).
You might use integers for:
Number of units
Year (either duration or referring to a specific calendar year)
Decimal
Numerical values with decimals.
You might use decimals for:
Area
Length
Ratio eg. FAR
Dollars
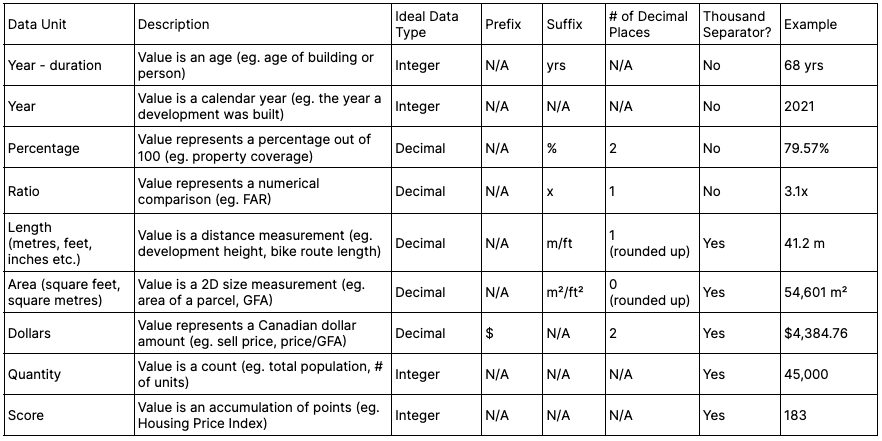
Data units
Data units represent the unit of measurement for a numeric value and may have a prefix or suffix. Assigning the correct unit means your data will be displayed with the correct formatting and enable imperial-metric conversions for linear and area measurements.
Below are the data units available on the Ratio.City platform and some examples of where you might use them.
Others
Boolean
Binary data type with one of two possible values (1/0 or Y/N).
You might use boolean for:
Pets allowed in the building - Y/N
Date
Values that have date information.
We can process dates in the following formats:
YYYY-MM-DD (2022-01-31)
YYYY/MM/DD (2022/01/31)
MM-DD-YYYY (01-31-2022)
MM/DD/YYYY (01/31/2022)
mmm DD, YYYY (Jan 31, 2022)
mmmm… DD, YYYY (January 31, 2022)
Currently, data fields defined as the ‘date’ data type will appear in map popups and reports, however the field cannot be used for layer styling.
Want some extra help?
If you have any questions about preparing your data for upload or during the upload process, contact our team at hello@ratio.city and our experts will get back to you ASAP.